February 11-15, Weekly Map Design Review
These two maps are good examples of strong map image design for the web. I have included an example of a type of simple animation that clearly and effectively shows the physical dynamic being modeled. This is contrasted witha static web-map which could have used web-animation but did not. In the first map, the animation runs for a full 10 frames of sequential motion and then repeats upon use of a button. This example illustrates how physical principles can be geographically portrayed with a legend, title, and area map that conveys information at a glance, either frozen statically or in motion. The other static map image uses the same geographic representation, but spells the numbers out in Fahrenheit , with the aid of additional colors to convey temperature extremes. Standard colors used for hot and cold are red and blue, with certain conventional variations from the color tool palette.
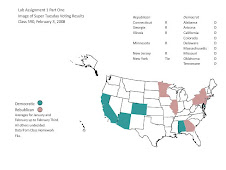
Political Map Example
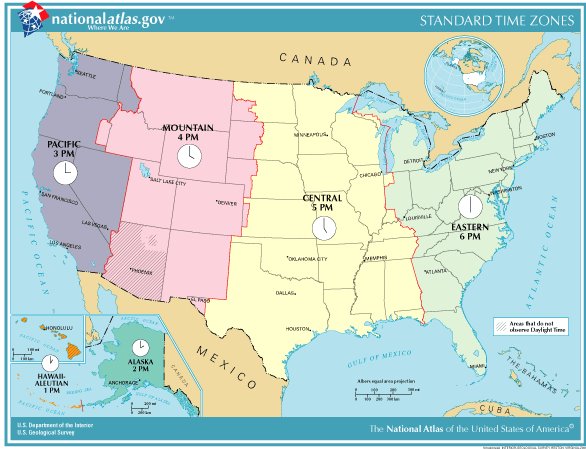
Time Zones Regional Agreement
Lab One Homework One
Static Image
