My link to my final Project is here. The major points I tried to consider were:
1. how to present statistical data in an animated format without changing the data from the source.
2. how to keep alot of numbers on only two pages.
3. how to have an alternate presentation of the data that was across several years,
4. how to have a spatial portrayal of the natural breaks in the data that didn't promise more accuracy than was there directly from the numbers.
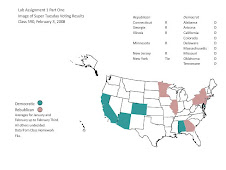
Political Map Example
Time Zones Regional Agreement
Lab One Homework One
Static Image
